THE LINUX FOUNDATION PROJECTS
All Posts By

Alena Davis

Exploring eBPF, IO Visor and Beyond

By Blog

I recently got acquainted with eBPF as the enabling technology for PLUMgrid’s distributed, programmable data-plane. While working on the product, perhaps due to my academic mindset,  my mind got piqued by this technology described here as the “In-kernel Universal Virtual Machine”.

This led me further explore the history for eBPF and its parent Linux Foundation project IO Visor, resulting in these set of slides [link], which I used to deliver talks at universities, labs, and conferences. I communicated the technology at a high level as well,  along with the efforts to make it more accessible by the  IO Visor Project (important since, as Brenden Gregg described, raw eBPF programming as “brutal”). While other people have already explained eBPF and IO Visor earlier (BPF Internals I, BPF Internals II, and IO Visor Challenges Open vSwitch) ,  I wanted to talk here about possible research directions and the wide scope for this exciting technology.

Before I go into these areas, however, a short primer on eBPF is essential for completeness.

A brief history of Packet Filters

So let’s start with eBPF’s ancestor — the Berkeley Packet Filter (BPF). Essentially built to enable line rate monitoring of packet, BPF allows description of a simple filter inside the kernel that lets through (to userspace) only those packets that meet its criteria. This is the technology used by tcpdump (and its derivatives like wireshark and other tools using libpcap). Let’s look at an example (taken from this Cloudflare blog):

$ sudo tcpdump -p -ni eth0 “ip and udp”

with this program, tcpdump will sniff through all traffic at the eth0 interface and return UDP packets only. Adding a -d flag to the above commands actually does something interesting:

(000) ldh      [12]
(001) jeq      #0x800           jt 2    jf 5
(002) ldb      [23]
(003) jeq      #0x11            jt 4    jf 5
(004) ret      #65535
(005) ret      #0

The above, recognizable as an assembly program for an ISA, shows a basic implementation of the filter as a bytecode that assumes a received packet resides at memory location [0] and then uses offset of Ethertype field and Protocol field, to drop packet the packet if UDP packet is not detected, by indicating a 0 (zero) return value.

This above code represents a bytecode for the BPF “psuedo-machine” architecture that is the underpinning of BPF. Thus what BPF provides is a simple machine architecture, sufficient to build packet filtering logic. Most of BPF safety guarantees arise from the very limited set of instructions allowed by the pseudo machine architecture, with a basic verifier to prevent loops was also exercise before the code is inserted inside the kernel. The in-kernel BPF is represented by an interpreter to allow the filter to be executed on every packet. For more details refer to this excellent blog post by Sukarma (link).

Extending BPF

Now this basic abstraction has been in the Linux kernel for nearly two decades, but recently got an upgrade with eBPF (e for extended) that has made BPF more than just a packet filter.

The main motivation behind eBPF was to extend the capabilities of BPF pseudo-machine to become more powerful and expressive, all the while providing the stability guarantees that ensured its existence in the kernel in the first place. This is a tough balancing act; on one hand making the BPF machine architecture more powerful means more machine instructions, more registers, bigger stack and 64 bit instructions. On the other hand  — in line with the “with great power comes great responsibility” adage —  the verification of the new bytecode also becomes significantly more challenging.

This challenge was taken up and delivered in the form of eBPF patch to the Linux kernel “filter”, with a new bpf syscall added from kernel 3.18. While the details of this new patch can be found at various different locations, including the presentation I have been giving, I will only briefly address the exciting new features and what they enable.

  • Souped up machine architecture: eBPF makes the  instruction set 64 bit and significantly expands its supported instruction count. Think of this like upgrading to a new Intel core architecture and the benefit in efficiency and capability therein. Another important consideration was to make the new architecture similar to x86-64, and ARM-64 architecture, thus allowing ease in writing a JIT compiler for eBPF bytecode.
  • Support for maps: This new feature allows storage of values between eBPF code execution. Notice that previously BPF programs were only run in isolation, with no-recall. The new map feature is crucially important as it allows the retention of state between every execution of eBPF code (full recall), thus allowing implementing a state-machine based on events triggering an eBPF function.
  • Helper functions: Helper functions are akin to having a library that allows eBPF programs — restricted to the confines of the isolated/virtualized pseudo-machine of BPF — to access resources (like the above mentioned maps) in an approved, kernel-safe way. This allows for increasing eBPF capabilities by offloading some functions, like requesting pseudo-numbers or recalculating checksum, to programs outside the eBPF code.
  • Tail-calls: As we noted earlier, pre-eBPF, programs would execute in isolation and had no (direct) control to trigger another filter/program. With the tail-call feature, an eBPF program can control the next eBPF program to execute. This ability allows a (sort-of) get-out-of-jail card from the per eBPF program restriction of 4096 instructions; more importantly it allows the ability to stitch containerized kernel code together —  hence enabling micro-services inside kernel.

There are lots of details about the internals of eBPF program types, where they can be hooked, and the type of context they work with all over the interwebs (links at the end of this blog). We will skip this to focus next on what are the various different things people are already doing, and some “out there ideas” that can  get people to start thinking in a different direction.

Before we go, note that most of the complexity of pushing code into kernel and then using helper-functions and tail-calls is being progressively reduced under the IO Visor Project’s github repository. This includes the ability to build code and manage maps through a python front-end (bcc) and a persistent file system in the form of bpf-fuse.

…. ask what eBPF can do for you?

So now that we understand the basics of the eBPF ecosystem, we discuss a few opportunities arising from having a programmable engine inside the kernel. Some of the ideas I will be throwing out there are already possible or being used, while others require some modifications to the eBPF ecosystem (by e.g., increasing the type of maps and helper functions)  — something a creative developer can upstream into the Linux kernel (not easy, I know!).

Security

While BPF was originally meant to help in packet-filtering, the seccomp patch allowed for mechanism to trap system calls and possibly block them, thereby limiting the number of calls accessible to an application.

With eBPF ability to have shared maps across instances, we can do dynamic taint analysis which has a minimal overhead. This will increase ability to track and stop malware and security breaches.

Similarly, with the ability to keep state, it will be trivial to implement stateful packet filtering. With eBPF, each application can also build their own filtering mechanism — thus web servers can post intelligent DDoS rejection programs, that block traffic at the kernel without disrupting the application thread, and can be configured through maps. These DDoS signatures can be generated using more involved DDoS detection algorithm present in the user-space.

Tracing

The introduction of eBPF has ignited significant interest in the tracing community. While I could describe several uses, the following blogs by Brenden Gregg (hist, off_cpu,uprobes), provide greater detail and convey the potential quite well.

Briefly, the ability to monitor kernel and user events (through kprobe and uprobe), then keep statistics in maps that can be polled from the user space provide  the key differentiation from other tracing tools. These are  useful as they enable the “Goldilocks effect” — the right amount of insight without perturbing the monitored system metric significantly.

Networking

Since eBPF programs can hook into different places of the networking stack, we can now program networking logic that can look at the entire payload, read any protocol header type, and keep state to implement any protocol machine. These capabilities allow for building a programmable data-plane inside commodity machines.

Another key feature of eBPF, the ability to call other programs, allows us to connect eBPF programs and pass packets between them. This in essence allows us to build an orchestration system that can connect eBPF program and implement a chain of network functions. Thus  third party vendors can build best-of-breed network elements, which can then be stitched together using the tail-call capability in eBPF. This independence guarantees greatest possible flexibility for users planning to build a powerful and cost-effective data-plane. The fact that PLUMgrid builds its entire ONS product line on top of this core functionality is a testament to its potential in this area as well.

IoT devices and development

How can a tech-blog be complete without throwing in the IoT buzz word? Well, it seems to me there is an interesting — albeit futuristic — application of eBPF in the IoT space. First, let me postulate that widespread IoT acceptance is hampered by the current approach of using  specialized, energy efficient operating systems like TinyOS, Contiki, RIOT. If instead we have the ability to use tools familiar to typical developers (within a standard Linux environment), the integration and development of solutions will be accelerated.

With the above premise, it is interesting to think of building an event-based microkernel like OS inside the monolithic Linux Kernel. This can happen if it becomes feasible (or safe) to trap (even if a subset of)  I/O interrupts and invoke an energy-aware scheduler to appropriate set state for both radio and processor on these devices. The event-driven approach to building an IoT application is perfectly inline with current best-practices, inasmuch that the above IoT specific OS use this approach for optimizing performance. At the same time, before deployment, and for debugging or even upgrading the IoT application, normal Linux tools will be available for developers and users alike.

Mobile Apps

Android will soon have eBPF functionality — when it does, the possibility of pushing functionality to monitor per application usage inside the kernel can make for some very interesting monitoring apps. We can implement several of the applications above, but with the additional benefits of having lower impact on the battery life.

Conclusion

While I have tried to convey a summary of eBPFs capability and its possible use-cases, community efforts driven by the IOVisor project continue to expand the horizon. IO Visor argues for an abstract model of an IO Module along with a mechanism to connect between such modules and other system components. These modules, described as an eBPF program, can as one instantiation be run within the Linux kernel, but can also be extrapolated to other implementations using offloads. Having the same interface, an eBPF program and its capabilities, will allow users to design and define IO interactions in an implementation independent way, with the actual implementation optimized for a particular use case e.g. NFV and data-plane acceleration.

If you are interested in IO Visor, join the IO Visor developer mailing, follow @iovisor twitter group and find out more about the project. See you there.

Useful Links

https://github.com/iovisor/bpf-docs
http://lwn.net/Articles/603984/
http://lwn.net/Articles/603983/
https://lwn.net/Articles/625224/
https://www.kernel.org/doc/Documentation/networking/filter.txt
http://man7.org/linux/man-pages/man2/bpf.2.html
https://videos.cdn.redhat.com/summit2015/presentations/13737_an-overview-of-linux-networking-subsystem-extended-bpf.pdf
https://github.com/torvalds/linux/tree/master/samples/bpf
http://lxr.free-electrons.com/source/net/sched/cls_bpf.c


About the author of this post
Affan Ahmed SyedAffan Ahmed Syed
Director Engineering at PLUMgrid Inc.
LinkedIn | Twitter: @aintiha

Linux eBPF Stack Trace Hack

By Blog

Stack trace support by Linux eBPF will make many new and awesome things possible, however, it didn’t make it into the just-released Linux 4.4, which added other eBPF features. Envisaging some time on older kernels that have eBPF but not stack tracing, I’ve developed a hacky workaround for doing awesome things now.

I’ll show my new bcc tools (eBPF front-end) that do this, then explain how it works.

stackcount: Frequency Counting Kernel Stack Traces

The stackcount tool frequency counts kernel stacks for a given function. This is performed in kernel for efficiency using an eBPF map. Only unique stacks and their counts are copied to user-level for printing.

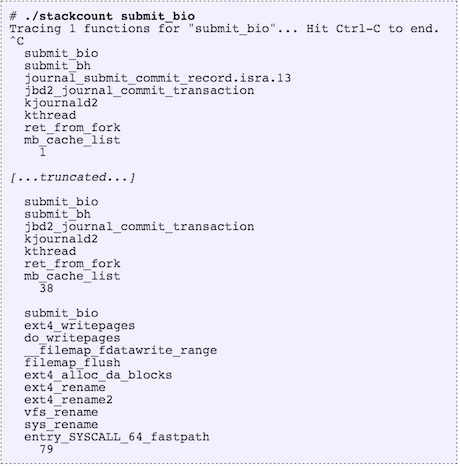
For example, frequency counting kernel stack traces that led to submit_bio():

linux_ebpf_stack_trace_hack_screen_shot_1

The order of printed stack traces is from least to most frequent. The most frequent in this example, printed last, was taken 79 times during tracing.

The last stack trace shows syscall handling, ext4_rename(), and filemap_flush(): looks like an application issued file rename has caused back end disk I/O due to ext4 block allocation and a filemap_flush().

This tool should be very useful for exploring and studying kernel behavior, quickly answering how a given function is being called.

stacksnoop: Printing Kernel Stack Traces

The stacksnoop tool prints kernel stack traces for each event. For example, for ext4_sync_fs():

linux_ebpf_stack_trace_hack_screen_shot_2

Since the output is verbose, this isn’t suitable for high frequency calls (eg, over 1,000 per second). You can use funccount from bcc tools to measure the rate of a function call, and if it is high, try stackcount instead.

How It Works: Crazy Stuff

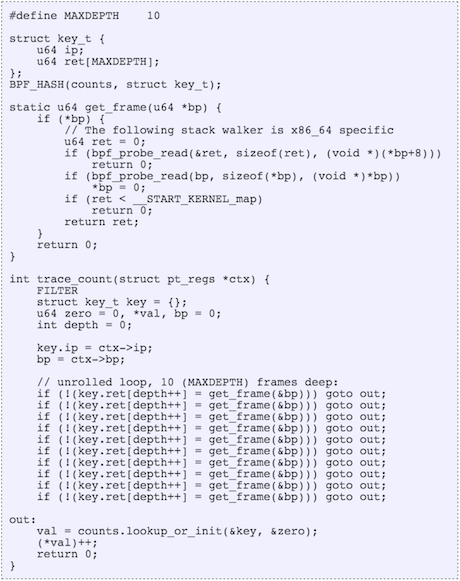
eBPF is an in-kernel virtual machine that can do all sorts of things, including “crazy stuff“. So I wrote a user-defined stack walker in eBPF, which the kernel can run. Here is the relevant code from stackcount (you are not expected to understand this):

linux_ebpf_stack_trace_hack_screen_shot_3

Once eBPF supports this properly, much of the above code will become a single function call.

If you are curious: I’ve used an unrolled loop to walk each frame (eBPF doesn’t do backwards jumps), with a maximum of ten frames in this case. It walks the RBP register (base pointer) and saves the return instruction pointer for each frame into an array. I’ve had to use explicit bpf_probe_read()s to dereference pointers (bcc can automatically do this in some cases). I’ve also left the unrolled loop in the code (Python could have generated it) to keep it simple, and to help illustrate overhead.

This hack (so far) only works for x86_64, kernel-mode, and to a limited stack depth. If I (or you) really need more, keep hacking, although bear in mind that this is just a workaround until proper stack walking exists.

Other Solutions

stackcount implements an important new capability for the core Linux kernel: frequency counting stack traces. Just printing stack traces, like what stacksnoop does, has been possible for a long time: ftrace can do this, which I use in my kprobe tool from perf-toolsperf_events can also dump stack traces and has a reporting mode that will print unique paths and percentages (although it is performed less efficiently in user mode).

SystemTap has long had the capability to frequency count kernel- and user-mode stack traces, also in kernel for efficiency, although it is an add-on and not part of the mainline kernel.

Future Readers

If you’re on Linux 4.5 or later, then eBPF may officially support stack walking. To check, look for something like a BPF_FUNC_get_stack in bpf_func_id. Or check the latest source code to tools like stackcount – the tool should still exist, but the above stack walker hack may be replaced with a simple call.

Thanks to Brenden Blanco (PLUMgrid) for help with this hack. If you’re at SCaLE14x you can catch his IO Visor eBPF talk on Saturday, and my Broken Linux Performance Tools talk on Sunday!

**Used with permission from Brendan Gregg. (original post)**

About the author of this post
brendan_rajasthan2011_thumbBrendan Gregg
Brendan Gregg is a senior performance architect at Netflix, where he does large scale computer performance design, analysis, and tuning. He is the author of Systems Performance published by Prentice Hall, and received the USENIX LISA Award for Outstanding Achievement in System Administration. He has previously worked as a performance and kernel engineer, and has created performance analysis tools included in multiple operating systems, as well as visualizations and methodologies.

Come and learn more about IO Visor at P4 Workshop

By Blog

After a successful and exciting OPNFV Summit last week, you can learn more about IO Visor at the 2nd P4 Workshop by Stanford/ONRC on Wednesday, November 18th. At 3:00pm I’ll discussing how IO Visor and the P4 language are ideally suited for each other in the session, P4 and IO Visor for Building Data Center Infrastructure Components. During this session you’ll see in action a programmable data plane and development tools simplifying the creation and sharing of dynamic “IO modules” for building your data center block by block. These IO modules can be used to create virtual network infrastructure, monitoring tools and security frameworks within your data center. You’ll also learn about eBPF, which enables infrastructure developers to create any in-kernel IO module and load/unload them at runtime, without recompiling or rebooting.

I’m looking forward to meeting all of you all at P4 Workshop this Wednesday.


About the author of this post

IO Visor Community to Highlight Networking, Tracing, and Policy Use Cases at OPNFV Summit

By News

Demos, Presentations to Highlight Capabilities of Project That Allows Modification of Linux Kernel at Runtime for Broad Set of NVF Applications.

SAN FRANCISCO // OPNFV SUMMIT // November 9, 2015 — Members of the IO Visor community will participate in this week’s OPNFV Summit, showing demonstrations of the latest build of the open source project, giving presentations and discussing diverse applications of the technology in the rapidly growing network functions virtualization (NFV) space.

Demos in the project’s booth (#209) will include tutorials on how to use IO Visor to implement group-based policy (GBP) for containers, as well as tracing and NFV deployment and operations.

Margaret Chiosi, president of OPNFV and distinguished network architect with AT&T will moderate a panel today at 11:05 am titled, “Programmable Data Planes and the Role of IO Visor in NFV.” Joining Chiosi are panelists including Keith Burns of Cisco, Yunsong Lu of Huawei, Bob Monkman of ARM, Chris Price of Ericsson and Pere Monclus of PLUMgrid.

The panel will discuss the factors driving the telecom industry to embrace NFV and its promises of faster time to market for new network services and flexibility through virtualization, programmability and automation. Programmable data planes are needed to achieve these benefits, as well as management and scalability of the network. The open source IO Visor project offers a Linux based, in-kernel programmable data plane that is independent of hardware systems and silicon. IO Visor is a Linux Foundation Collaborative Project.

IO Visor advances IO and networking technologies to address new requirements presented by cloud computing, the Internet of Things (IoT), Software-Defined Networking (SDN) and Network Function Virtualization (NFV). An industry transformation is underway in which virtualization is accelerating and driving the IT industry to seek faster service delivery and higher efficiency. As virtualization of compute, storage and networking continues to grow, fundamental changes in the way IO and networking subsystems are designed are required.

Learn more about IO Visor by visiting the community’s website at http://www.iovisor.org.

BPF INTERNALS – II

By Blog

bpf-internals-ii-01

Continuing from where I left before, in this post we would see some of the major changes in BPF that have happened recently – how it is evolving to be a very stable and accepted in-kernel VM and can probably be the next big thing – in not just filtering but going beyond. From what I observe, the most attractive feature of BPF is its ability to give access to the developers so that they can execute dynamically compiled code within the kernel – in a limited context, but still securely. This itself is a valuable asset.

As we have seen already, the use of BPF is not just limited to filtering out network packets but for seccomp, tracing etc. The eventual step for BPF in such a scenario was to evolve and come out of it’s use in the network filtering world. To improve the architecture and bytecode, lots of additions have been proposed. I started a bit late when I saw Alexei’s patches for kernel version 3.17-rcX. Perhaps, this was the relevant mail by Alexei that got me interested in the upcoming changes. So, here is a summary of what all major changes have occured. We will be seeing each of them in sufficient detail.

Architecture

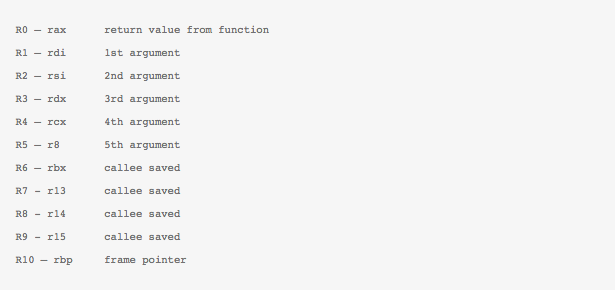
The classic BPF we discussed in the last post had two 32 bit registers – A and X. All arithmetic operations were supported and performed using these two registers. The newer BPF called extended-BPF or eBPF has ten 64 bit registers and supports arbitary load/stores. It also contains new instructions like BPF_CALL which can be used to call some new kernel-side helper functions. We will look into this in detail a bit later as well. The new eBPF follows calling conventions which are more like modern machines (x86_64). Here is the mapping of the new eBPF registers to x86 registers:

bpf-internals-ii-01-1

The closeness to the machine ABI also ensures that unnecessary register spilling/copying can be avoided. The R0 register stores the return from the eBPF program and the eBPF program contexts can be loaded through register R1. Earlier, there used to be just two jump targets i.e. either jump to TRUE or FALSE targets. Now, there can be arbitary jump targets – true or fall through. Another aspect of the eBPF instruction set is the ease of use with the in-kernel JIT compiler. eBPF Registers and most instructions are now mapped one-to-one. This makes emitting these eBPF instructions from any external compiler (in userspace) not such a daunting task. Of course, prior to any execution, the generated bytecode is passed through a verifier in the kernel to check its sanity. The verifier in itself is a very interesting and important piece of code and probably story for another day.

Building BPF Programs

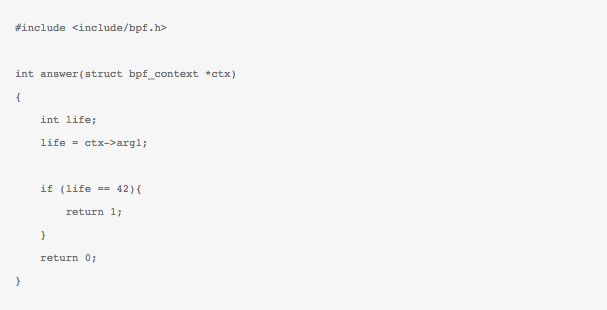
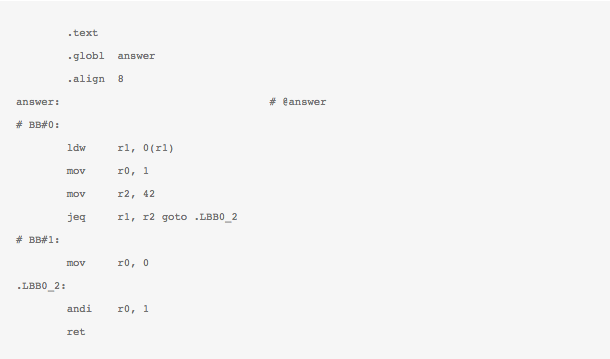
From a users perspective, the new eBPF bytecode can now be another headache to generate. But fear not, an LLVM based backend now supports instructions being generated for BPF pseudo-machine type directly. It is being ‘graduated’ from just being an experimental backend and can hit the shelf anytime soon. In the meantime, you can always use this script to setup the BPF supported LLVM yourslef. But, then what next? So, a BPF program (not necessarily just a filter anymore) can be done in two parts – A kernel part (the BPF bytecode which will get loaded in the kernel) and the userspace part (which may, if needed gather data from the kernel part) Currently you can specify a eBPF program in a restricted C like language. For example, here is a program in the restricted C which returns true if the first argument of the input program context is 42.  Nothing fancy :

include

This C like syntax generates a BPF binary which can then be loaded in the kernel. Here is what it looks like in BPF ‘assembly’ representation as generated by the LLVM backed (supplied with 3.4) :

6

If you are adventerous enough, you can also probably write complete and valid BPF programs in assembly in a single go – right from your userspace program. I do not know if this is of any use these days. I have done this sometime back for a moderately elaborate trace filtering program though. It is also not effective as well, becasue I think at this point in human history, LLVM can generate assembly better and more efficiently than a human.

What we discussed just now is probably not a relevant program anymore. An example by Alexei here is what is more relevant these days. With the integration of Kprobe with BPF, a BPF program can be run at any valid dynamically instrumentable function in the kernel. So now, we can probably just use pt_regs as the context and get individual register values at each time the probe is hit. As of now, some helper functions are available in BPF as well, which can get the current timestamp. You can have a very cheap tracing tool right there 🙂

BPF Maps

I think one of the most interesting features in this new eBPF is the BPF maps. It looks like an abstract data type – initially a hash-table, but from kernel 3.19 onwards, support for array-maps seems to have been added as well. These bpf_maps can be used to store data generated from a eBPF program being executed. You can see the implementation details in arraymap.c or hashtab.c Lets pause for a while and see some more magic added in eBPF – esp. the BPF syscall which forms the primary interface for the user to interact and use eBPF. The reason we want to know more about this syscall is to know how to work with these cool BPF maps.

BPF Syscall

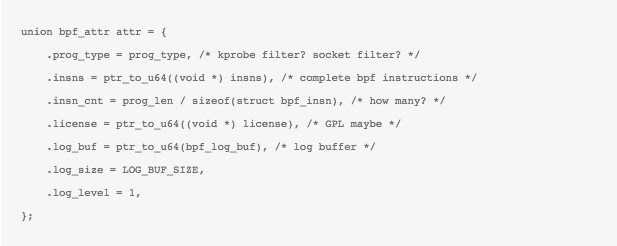
Another nice thing about eBPF is a new syscall being added to make life easier while dealing with BPF programs. In an article last year on LWN Jonathan Corbet discussed the use of BPF syscall. For example, to load a BPF program you could call

1_0

with of course, the corresponding bpf_attr structure being filled before :

4

Yes, this may seem cumbersome to some, so for now, there are some wrapper functions inbpf_load.c and libbpf.c released to help folks out where you may need not give too many details about your compiled bpf program. Much of what happens in the BPF syscall is determined by the arguments supported here. To elaborate more, let’s see how to load the BPF program we did before. Assuming that we have the sample program in its BPF bytecode form generated and now we want to load it up, we take the help of the wrapper function load_bpf_file() which parses the BPF ELF file and extracts the BPF bytecode from the relevant section. It also iterates over all ELF sections to get licence info, map info etc. Eventually, as per the type of BPF program – Kprobre/kretprobe or socket program, and the info and bytecode just gathered from the ELF parsing, the bpf_attr attribute structure is filled and actual syscall is made.

Creating and accessing BPF maps

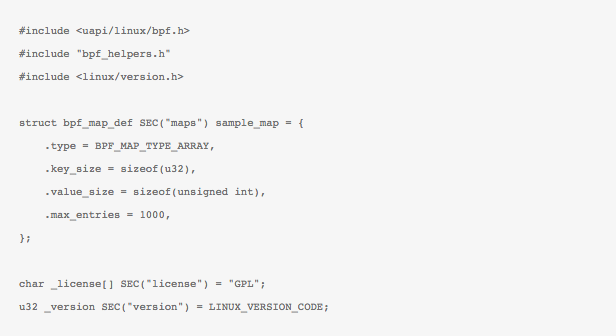
Coming back to the maps, apart from this simple syscall to load the BPF program, there are many more actions that can be taken based on just the arguments. Have a look at bpf/syscall.c From the userspace side the new BPF syscall comes to the rescue and allows most of these operations on bpf_maps to be performed! From the kernel side however, with some special helper function and the use of BPF_CALL instruction, the values in these maps can be updated/deleted/accessed etc. These helpers inturn call the actual function according to the type of map – hash-map or an array. For example, here is a BPF program that just creates an array-map and does nothing else,

3

When loaded in the kernel, the array-map is created. Form the userspace we can then probably initialize the map with some values with a function that look likes this,

2_0

where bpf_update_elem() wrapper is in-turn calling the BPF syscall with proper arguments and attributes as,

1_0-1

This inturn calls map_update_elem() which securely copies the key and value using copy_from_user() and then calls the specialized function for updating the value for array-map at the specified index. Similar things happen for reading/deleting/creating has or array maps from userspace.

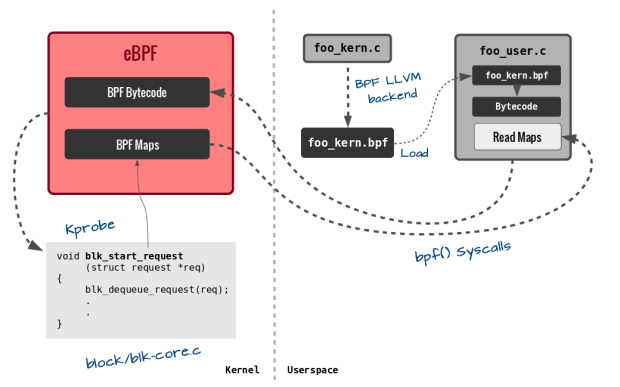
So probably, things will start falling into pieces now from the earlier post by Brendan Gregg where he was updating a map from the BPF program (using the BPF CALL instruction which calls the internal kernel helpers) and then concurrently accessing it from userspace to generate a beautiful histogram (through the syscall I just mentioned above). BPF Maps are indeed a very powerful addition to the system. You can also checkout more detailed and complete examplesnow that you know what is going on. To summarize, this is how an example BPF program written in restricted C for kernel part and normal C for userspace part would run these days:

ebpf-session

In the next BPF post, I will discuss the eBPF  verifier in detail. This is the most crucial part of BPF and deserves detailed attention I think. There is also something cool happening these days on the Plumgrid side I think – the BPF Compiler Collection. There was a very interesting demo using such tools and the power of eBPF at the recent Red Hat Summit. I got BCC working and tried out some examples with probes – where I could easily compile and load BPF programs from my Python scripts! How cool is that   Also, I have been digging through the LTTng’s interpreter lately so probably another post detailing how the BPF and LTTng’s interpreters work would be nice to know. That’s all for now. Run BPF.


About the author of this post

BPF INTERNALS – I

By Blog

Recent post by Brendan Gregg inspired me to write my own blog post about my findings of how Berkeley Packet Filter (BPF) evolved, it’s interesting history and the immense powers it holds – the way Brendan calls it ‘brutal’. I came across this while studying interpreters and small process virtual machines like the proposed KTap’s VM. I was looking at some known papers on register vs stack basd VMs, their performances and various code dispatch mechanisms used in these small VMs. The review of state-of-the-art soon moved to native code compilation and a discussion on LWN caught my eye. The benefits of JIT were too good to be overlooked, and BPF’s application in things like filtering, tracing and seccomp (used in Chrome as well) made me interested. I knew that the kernel devs were on to something here. This is when I started digging through the BPF background.

Background

Network packet analysis requires an interesting bunch of tech. Right from the time a packet reaches the embedded controller on the network hardware in your PC (hardware/data link layer) to the point they do someting useful in your system, such as display something in your browser (application layer). For connected systems evolving these days, the amount of data transfer is huge, and the support infrastructure for the network analysis needed a way to filter out things pretty fast. The initial concept of packet filtering developed keeping in mind such needs and there were many stategies discussed with every filter such as CMU/Stanford packet Filter (CSPF), Sun’s NIT filter and so on. For example, some earlier filtering approaches used a tree based model (in CSPF) to represenf filters and filter them out using predicate-tree walking. This earlier approach was also inherited in the Linux kernel’s old filter in the net subsystem.

Consider an engineer’s need to have a probably simple and unrealistic filter on the network packets with the predicates P1, P2, P3 and P4:

bpf-diagram-01

Filtering approach like the one of CSPF would have represented this filter in a expression tree structure as follows:

bpf-diagram-02
It is then trivial to walk the tree evaluating each expression and performing operations on each of them. But this would mean there can be extra costs assiciated with evaluating the predicates which may not necessarily have to be evaluated. For example, what if the packet is neither an ARP packet nor an IP packet? Having the knowledge that P1 and P2 predicates are untrue, we may need not have to evaluate other 2 predicates and perform 2 other boolean operation on them to determine the outcome.

In 1992-93, McCanne et al. proposed a BSD Packet Filter with a new CFG-bytecode based filter design. This was an in-kernel approach where a tiny interpreter would evaluate expressions represented as BPF bytecodes. Instead of simple expression trees, they proposed a CFG based filter design. One of the control flow graph representation of the same filter above can be:

bpf-diagram-03

The evaluation can start from P1 and the right edge is for FALSE and left is for TRUE with each predicate being evaluated in this fashion until the evaluation reaches the final result of TRUE or FALSE. The inherent property of ‘remembering’ in the CFG, i.e, if P1 and P2 are false, the path reaches a final FALSE is remembered and P3 and P4 need not be evaluated. This was then easy to represent in bytecode form where a minimal BPF VM can be designed to evaluate these predicates with jumps to TRUE or FALSE targets.

The BPF Machine

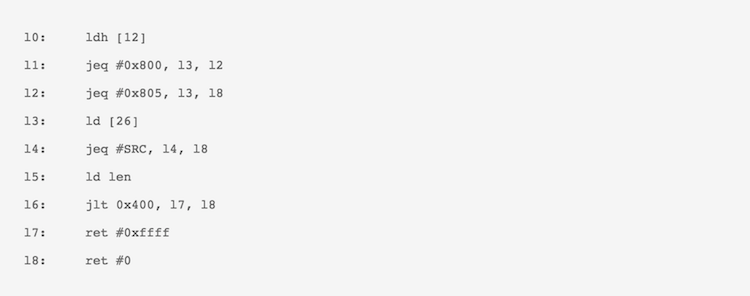
A pseudo-instruction representation of the same filter described above for earlier versions of BPF in Linux kernel can be shown as,

bpf-code-01
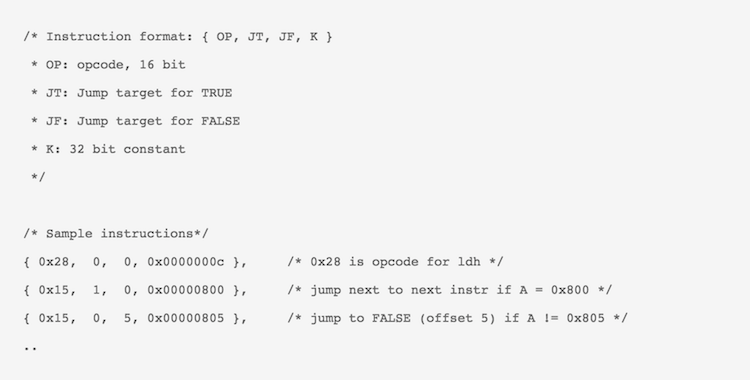
To know how to read these BPF instructions, look at the filter documentation in Kernel source and see what each line does. Each of these instructions are actually just bytecodes which the BPF machine interprets. Like all real machines, this requires a definition of how the VM internals would look like. In the Linux kernel’s version of the BPF based in-kernel filtering technique they adopted, there were initially just 2 important registers, A and X with another 16 register ‘scratch space’ M[0-15]. The Instruction format and some sample instructions for this earlier version of BPF are shown below:

bpf-code-02_0

There were some radical changes done to the BPF infrastructure recently – extensions to its instruction set, registers, addition of things like BPF-maps etc. We shall discuss what those changes in detail, probably in the next post in this series. For now we’ll just see the good ol’ way of how BPF worked.

Interpreter

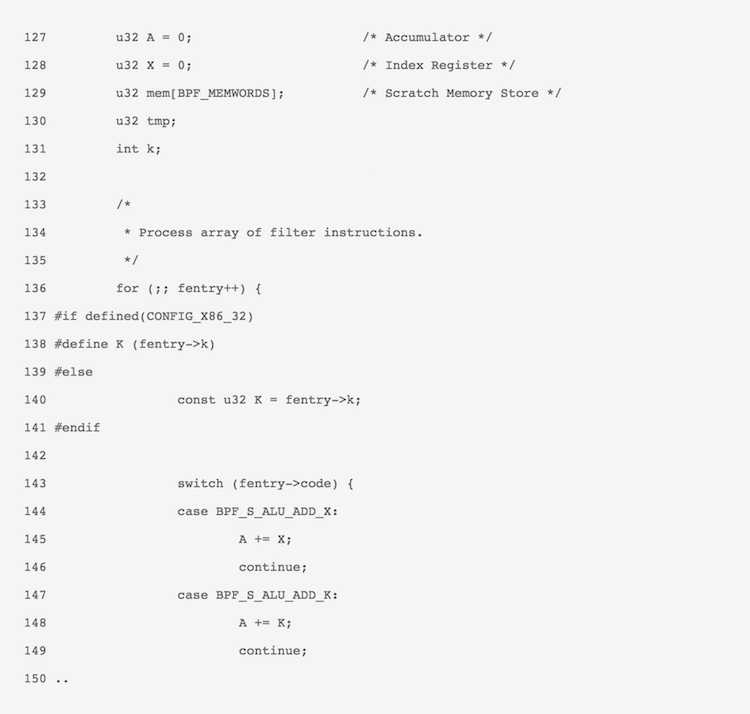
Each of the instructions seen above are represented as arrays of these 4 values and each program is an array of such instructions. The BPF interpreter sees each opcode and performs the operations on the registers or data accordingly after it goes through a verifier for a sanity check to make sure the filter code is secure and would not cause harm. The program which consists of these instructions, then passes through a dispatch routine. As an example, here is a small snippet from the BPF instruction dispatch for the instruction ‘add’ before it was restructured in Linux kernel v3.15 onwards,

bpf-code-03_0

Above snippet is taken from net/core/filter.c in Linux kernel v3.14. Here, fentry is the socket_filter structure and the filter is applied to the sk_buff data element. The dispatch loop (136), runs till all the instructions are exhaused. The dispatch is basically a huge switch-case dispatch with each opcode being tested (143) and necessary action being taken. For example, here an ‘add’ operation on registers would add A+X and store it in A. Yes, this is simple isn’t it? Let us take it a level above.

JIT Compilation

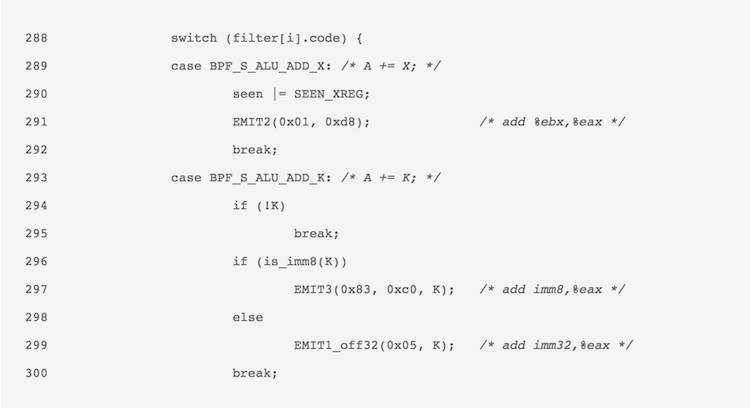
This is nothing new. JIT compilation of bytecodes has been there for a long time. I think it is one of those eventual steps taken once an interpreted language decides to look for optimizing bytecode execution speed. Interpreter dispatches can be a bit costly once the size of the filter/code and the execution time increases. With high frequency packet filtering, we need to save as much time as possible and a good way is to convert the bytecode to native machine code by Just-In-Time compiling it and then executing the native code from the code cache. For BPF, JIT was discussed first in the BPF+ research paper by Begel etc al. in 1999. Along with other optimizations (redundant predicate elimination, peephole optimizations etc,) a JIT assembler for BPF bytecodes was also discussed. They showed improvements from 3.5x to 9x in certain cases. I quickly started seeing if the Linux kernel had done something similar. And behold, here is how the JIT looks like for the ‘add’ instruction we discussed before (Linux kernel v3.14),

bpf-code-04_0

As seen above in arch/x86/net/bpf_jit_comp.c for v3.14, instead of performing operations during the code dispatch directly, the JIT compiler emits the native code to a memory area and keeps it ready for execution.The JITed filter image is built like a function call, so we add some prologue and epilogue to it as well,

bpf-code-05_0

There are rules to BPF (such as no-loop etc.) which the verifier checks before the image is built as we are now in dangerous waters of executing external machine code inside the linux kernel. In those days, all this would have been done by bpf_jit_compile which upon completion would point the filter function to the filter image,

bpf-code-06_0

Smooooooth… Upon execution of the filter function, instead of interpreting, the filter will now start executing the native code. Even though things have changed a bit recently, this had been indeed a fun way to learn how interpreters and JIT compilers work in general and the kind of optimizations that can be done. In the next part of this post series, I will look into what changes have been done recently, the restructuring and extension efforts to BPF and its evolution to eBPF along with BPF maps and the very recent and ongoing efforts in hist-triggers. I will discuss about my experiemntal userspace eBPF library and it’s use for LTTng’s UST event filtering and its comparison to LTTng’s bytecode interpreter. Brendan’s blog-post is highly recommended and so are the links to ‘More Reading’ in that post.

Thanks to Alexei Starovoitov, Eric Dumazet and all the other kernel contributors to BPF that I may have missed. They are doing awesome work and are the direct source for my learnings as well. It seems, looking at versatility of eBPF, it’s adoption in newer tools like shark, and with Brendan’s views and first experiemnts, this may indeed be the next big thing in tracing.


About the author of this post

New IO Visor Project to Advance Linux Networking and Virtualization for Modern Data Centers

By Announcement

Barefoot Networks, Broadcom, Canonical, Cavium, Cisco, Huawei, Intel, PLUMgrid and SUSE among founding members to build an open programmable data plane for IO and networking applications

SEATTLE, LinuxCon/CloudOpen/ContainerCon, August 17, 2015 — The Linux Foundation, the nonprofit organization dedicated to accelerating the growth of Linux and collaborative development, today announced the IO Visor Project. Founding members of IO Visor include Barefoot Networks, Broadcom, Canonical, Cavium, Cisco, Huawei, Intel, PLUMgrid and SUSE.

This Linux Foundation Collaborative Project will advance IO and networking technologies to address new requirements presented by cloud computing, the Internet of Things (IoT), Software-Defined Networking (SDN) and Network Function Virtualization (NFV). An industry transformation is underway in which virtualization is accelerating and driving the IT industry to seek faster service delivery and higher efficiency. As virtualization of compute, storage and networking continues to grow, fundamental changes in the way IO and networking subsystems are designed are required.

“IO Visor will work closely with the Linux kernel community to advance universal IO extensibility for Linux. This collaboration is critically important as virtualization is putting more demands on flexibility, performance and security,” said Jim Zemlin, executive director, The Linux Foundation. “Open source software and collaborative development are the ingredients for addressing massive change in any industry. IO Visor will provide the essential framework for this work on Linux virtualization and networking.”

“Advancing IO and network virtualization in the Linux stack can be an enabler of agility and elasticity, which are key requirements for cloud deployments and applications. IO Visor Project’s mission to bring universal IO extensibility to the Linux kernel will accelerate innovation of virtual network functions in SDN and NFV deployments,” said Rohit Mehra, Vice President of Network Infrastructure, IDC.  “The ability to create, load and unload in-kernel functions will enable developers in many upstream and downstream open source projects. What’s more, as an initiative under the auspices of the Linux Foundation, the IO Visor Project has the potential for credibility and momentum to benefit the diverse community of vendors and service providers, and ultimately enterprise IT.”

IO Visor is an open source project and community of developers that will enable a new way to innovate, develop and share IO and networking functions. It will provide a neutral forum in which participants can contribute and advance technology for an open programmable data plane for modern IO and networking applications and will provide development tools for the creation of high-speed, event-driven functions for distributed network environments from the data center to IoT and more.

This collaboration is expected to result in user benefits that include flexibility of programmable, extensible architecture with dynamic IO modules that can be loaded and unloaded in kernel at run time without recompilation and to deliver high performance and distributed, scale-out forwarding without compromise on functionality, among other features and benefits.

“I am encouraged to see the wide variety participants in the IO Visor ecosystem, as this suggests the project will benefit from diverse perspectives. The industry is wrestling with performance, security and scalability as it operationalizes new cloud, SDN and NFV technologies—the very areas IO Visor is aiming to address. I look forward to seeing how this initiative will collaborate with others, such as OpenDaylight and OPNFV, to accelerate cloud, SDN and NFV-driven transformation,” said Rosalyn Roseboro, Heavy Reading.

The IO Visor Project is supported initially with contributions from PLUMgrid. IO Visor will include a Board of Directors and Technical Steering Committee to govern the work and contributions from the community going forward. For more information about the IO Visor Project please visit: https://www.iovisor.org/

IO Visor is a Linux Foundation Collaborative Project. Collaborative Projects are independently supported software projects that harness the power of collaborative development to fuel innovation across industries and ecosystems. By spreading the collaborative DNA of the largest collaborative software development project in history, The Linux Foundation provides the essential collaborative and organizational framework so project hosts can focus on innovation and results. Linux Foundation Collaborative Projects span the enterprise, mobile, embedded and life sciences markets and are backed by many of the largest names in technology. For more information about Linux Foundation Collaborative Projects, please visit: http://collabprojects.linuxfoundation.org/

Member Quote

Barefoot Networks
“In the next few years, it will become commonplace to program the forwarding plane; programmability is the key to adding new features and greater visibility into networks,” said Martin Izzard, CEO at Barefoot Networks. “Barefoot is delighted to be a founding member of the IO Visor project and will contribute its experience and use of P4 as the event driven language.”

Broadcom
“We are supporting IO Visor project from Linux Foundation as it enables broader access to the rich suite of industry leading capabilities across Broadcom’s networking portfolio,” said Eli Karpilovski, Director of SDN and cloud ecosystem at Broadcom.

Canonical
John Zannos, Canonical’s Vice President of Cloud Alliances, said: “As organisations continue to accelerate the rollout of new services, hypervisor technology has become a key enabler. IO Visor’s fully-distributed data plane architecture enables the hosting of planes of distributed network functions, which will scale out without impacting throughput or performance. PLUMgrid has taken a huge step in making IO Visor open and community-driven; as a leader in open hypervisor technologies and software-defined solutions, Canonical is pleased to support this initiative, which will help ensure scale and make the creation of VNF-based applications simpler.”

Cisco
“I/O function virtualization enables mission critical scale and performance for cloud native, NFV and IoT applications,” said Lauren Cooney, Senior Director of Software Strategy for the Chief Technology Office, Cisco. “The work to bring I/O extensibility to the Linux Kernel, with a fully distributed data plane, is important to support the next generation of dynamic applications. Efforts to simplify and improve the overall developer experience and provide an open and flexible environment, such as the IO Visor Project, is necessary to help customers scale their businesses quickly and successfully. We’re excited to be a part of this community initiative to further drive new I/O and networking functions and continue our commitment to enable users by open source.”

Huawei
“IO Visor’s ability to extend programmability with dynamic IO in the Linux Kernel allows virtualized network functions with SDN and NFV to be delivered in data centers more efficiently, without reconfiguring the network. This will increase the overall performance and stability while reducing the operating cost for our customers,” said Yunsong Lu, CTO of software laboratory at Huawei. “We believe there will be increasing scenarios where this technology will be deployed, allowing networking to become more flexible and agile. Huawei will continue our commitment to drive this initiative and help our customers to succeed.”

PLUMgrid
“The ability to modify a Linux kernel at runtime without rebooting the server or entire data center is critical to efficient operation of SDN and NFV technologies,” said Pere Monclus, founder and CTO at PLUMgrid. “As a company that actively supports a number of open source projects, we believe that open sourcing IO Visor through a community hosted with the Linux Foundation was in the best interests of not only our company, but of everyone dependent upon agile and highly performant cloud technologies at scale.”

SUSE
“Customers are accelerating their migration to the cloud, which is putting pressure on software developers to keep up with their rapidly evolving business requirements,” said Michael Miller, vice president of global alliances and marketing at SUSE. “By extending the Linux kernel, IO Visor speeds up innovation of SDN and NFV technology and further solidifies Linux as the foundation of the software-defined data center.”

About The Linux Foundation

The Linux Foundation is a nonprofit consortium dedicated to fostering the growth of Linux and collaborative software development. Founded in 2000, the organization sponsors the work of Linux creator Linus Torvalds and promotes, protects and advances the Linux operating system and collaborative software development by marshaling the resources of its members and the open source community. The Linux Foundation provides a neutral forum for collaboration and education by hosting Collaborative Projects, Linux conferences, including LinuxCon and generating original research and content that advances the understanding of Linux and collaborative software development. More information can be found at www.linuxfoundation.org.

Hello World!

By Blog

First off: welcome to the IO Visor Project! We are excited for the birth of this community and thrilled about the future that lays ahead of us all.

It has been over 4 years since the conception of what has now become the IO Visor Project, and it feels like a pretty adventurous journey. We’d like to take you down Memory Lane and share  how a group of end users and vendors got here and what the IO Visor Project is all about.

So … how did the IO Visor Project started?

Several PLUMgrid engineers had a vision: a dream of creating a new type of programmable data plane. This new type of extensible architecture would for the first time enable developers to dynamically build IO modules (think stand alone “programs” that can manipulate a packet in the kernel and perform all sort of functions on it), load and unload those in-kernel at run time and do it without any disruption to the system.

We wanted to transform how functions like networking or security or tracing are designed, implemented and delivered and more importantly we wanted to build a technology that would future-proof large-scale deployments with easy-to-extend functionalities.

Yes, it was an ambitious target but this is why we contributed initial IP and code to kickstart the IO Visor Project. Now, a diverse and engaged open source community is taking that initial work and running with it. A technology, compilers, a set of developers tools and real-world use case examples that can be used to create the next set of IO Module that your application and users demand.

What is so unique about it?

The developers that work on eBPF (extended Berkeley Packet Filter, the core technology behind IO Visor Project) refer to it as universal in-kernel virtual machine with run-time extensibility. IO Visor provides infrastructure developers the ability to create applications, publish them, deploy them in live systems without having to recompile or reboot a full datacenter. The IO modules are platform independent, meaning that they could run on any hardware  that uses Linux.

Running IO and networking functions in-kernel delivers the performance of hardware without layers of software and middleware. With functions running in-kernel of each compute node in a data center, IO Visor enables distributed, scale-out performance, eliminating hairpinning, tromboning and bottlenecks that are prevalent in so many implementations today.

Data center operators no longer need to compromise on flexibility and performance.

And finally … why should you care?

  1. This is the first time in the history of the Linux kernel that a developer can envision a new functionality and simply make it happen.

  2. Use cases are constantly changing, and we need an infrastructure that can evolve with them.

  3. Software development cycles should not be longer than hardware cycle.

  4. Single-node implementations won’t cut it in the land of cattle.

Where next?

Browse through iovisor.org where you will find plenty resources and information on the project and its components. Although the IO Visor Project was just formed, there is a lively community of developers who have been working together for several years. The community leverages Github for developer resources at https://github.com/iovisor

The IO Visor Project is open to all developers and there is no fee to join or participate so we hope to see many of you become a part of it!

Welcome again to the IO Visor Project!


About the author of this post